In today’s post, I take a closer look at how the different parks in the Cedar Fair chain contribute to the company’s overall revenue and EBITDA. As both a fan and member of the amusement park/theme park industry, I am always searching for ways to learn more about the many incredible companies that operate parks all over the world. Although I enjoy putting on my “fan hat” from time-to-time to read speculation and theories about new rides, I find the most interesting insights come from looking at each business holistically. At the end of the day every park is a business, a fun business, but still a business that is best understood by analyzing it through such a lenses.
There are very few resources to turn to for coverage and data about the inner workings of the industry. The Global Attractions and Attendance Report compiled by the Themed Entertainment Association (TEA) and AECOM is one of the best resources available. Unfortunately, even that report relies on unofficial guesstimates and is considered by many in the industry, including myself, to be directionally, but not completely accurate. The most accurate sources of information are the earnings calls, SEC filings and investor presentations that the major public companies in the amusement park industry release on a quarterly basis. Unfortunately, public companies only release tidbits of financial information that typically focus on the overall company and not specific parks or areas of the business. Large conglomerates such as Disney and Comcast provide less data as the theme park business only accounts for one part of their overall companies. On rare occasions, companies will provide more insightful and complete information about how their business operates at the park level.

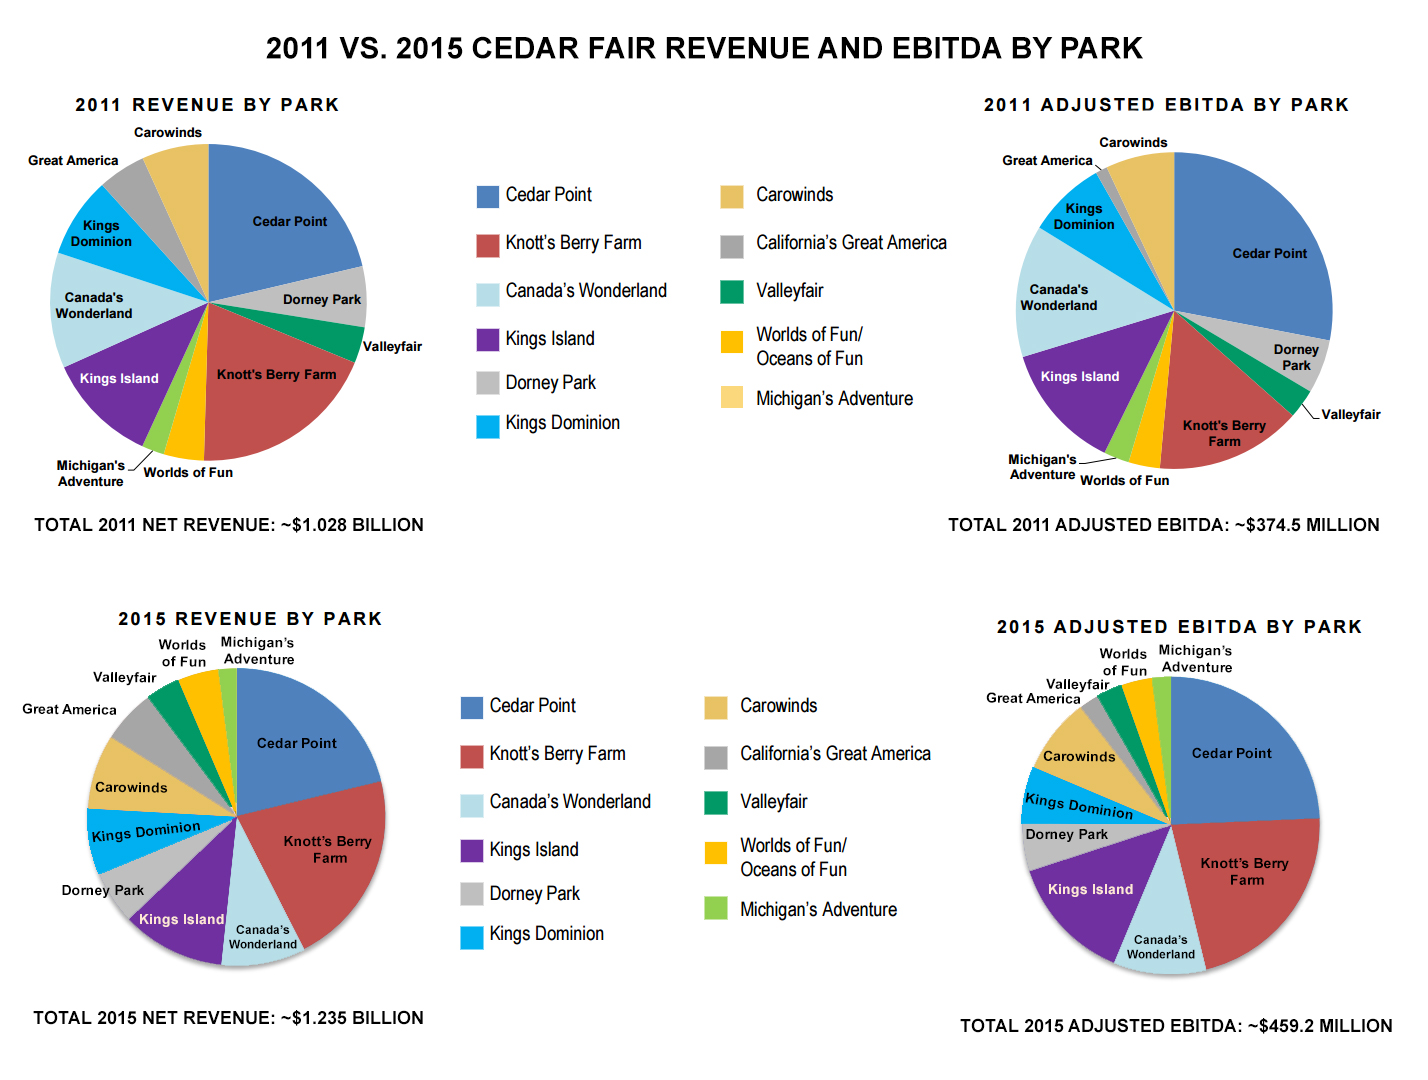
In 2012, Matt Ouimet became CEO of Cedar Fair and ushered in a new era for the company. During his first month at the helm, Cedar Fair announced the FUNForward strategy to grow the company by focusing on enhancing the guest experience, providing new premium products, capital and expense productivity, dynamic pricing and a modernized approach to marketing/sales. As part of the program, Cedar Fair released a series of investor presentations providing an overview of the company with previously unpublished data. The following attendance breakdown of the Cedar Fair chain is from the first FUNForward presentation from January 2012. The contribution comparison between parks of revenue and EBITDA is gleaned from that report along with information contained in the last year’s FUNForward 2.0 report.
Cedar Fair Amusement Parks Attendance
In the 2012 FUNForward presentation, Cedar Fair places their eleven parks into three different attendance categories. Keep in mind that this categorization was performed using 2011 attendance numbers.
~3 Million Or More Guests On An Annual Basis
• Cedar Point (Sandusky, OH)
• Knott’s Berry Farm (Buena Park, CA)
• Canada’s Wonderland (Toronto, ON)
• Kings Island (Cincinnati, OH)
~1.5 Million Or More Guests On An Annual Basis
• Carowinds (Charlotte, NC)
• Kings Dominion (Richmond, VA)
• Dorney Park (Allentown, PA)
• California’s Great America (Santa Clara, CA)
~1 Million Or Fewer Guests On An Annual Basis
• Valleyfair (Shakopee, MN)
• Worlds of Fun (Kansas City, MO)
• Michigan’s Adventure (Muskegon, MI)
Cedar Fair Amusement Parks Revenue And EBITDA
Both reports provide more information about how each park contributes to the company’s bottom-line through revenue and EBITDA. I put together the following 2011 vs. 2015 comparison using pie charts from the two reports. Attendance is usually what most fan websites and industry outlets focus on, but looking at revenue and EBITDA produces entirely new observations.
For instance, the below charts show that California’s Great America produces revenue similar to other parks in its attendance category yet earnings for the park are closer to the million and under attendance category. What could be causing this big drop? Great America is the only park that doesn’t own its land and has to pay rent. The comparison charts also show steady growth for both Carowinds and Knott’s Berry Farm between 2011 and 2015. What other insights can you glean from the graphs?
Reviewing the FUNForward reports also help provide an idea into what questions are asked when new capital decisions are made: Where is the best place to put a new ride to generate the maximum return on my investment? Is the regional population and economy growing around the park? What park needs new capital to stay competitive in their market?

Please Note: All information and conclusions mentioned in this post came from publicly available Cedar Fair’s FunForward investment presentations. No proprietary company information was used from my position as Digital Marketing Manager at Knott’s Berry Farm (Owned by Cedar Fair Entertainment).